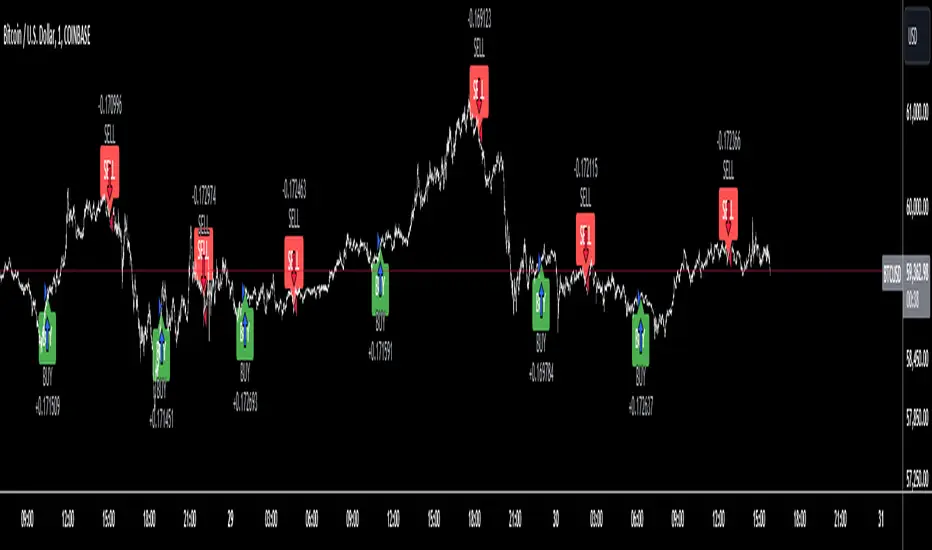
ICT Indicator with Paper TradingThe strategy implemented in the provided Pine Script is based on **ICT (Inner Circle Trader)** concepts, particularly focusing on **order blocks** to identify key levels for potential reversals or continuations in the market. Below is a detailed description of the strategy:
### 1. **Order Block Concept**
- **Order blocks** are price levels where large institutional orders accumulate, often leading to a reversal or continuation of price movement.
- In this strategy, **order blocks** are identified when:
- The high of the current bar crosses above the high of the previous bar (for bullish order blocks).
- The low of the current bar crosses below the low of the previous bar (for bearish order blocks).
### 2. **Buy and Sell Signal Generation**
The core of the strategy revolves around identifying the **breakout** of order blocks, which is interpreted as a signal to either enter or exit trades:
- **Buy Signal**:
- Generated when the closing price crosses **above** the last identified bullish order block (i.e., the highest point during the last upward crossover of highs).
- This signals a potential upward trend, and the strategy enters a long position.
- **Sell Signal**:
- Generated when the closing price crosses **below** the last identified bearish order block (i.e., the lowest point during the last downward crossover of lows).
- This signals a potential downward trend, and the strategy exits any open long positions.
### 3. **Strategy Execution**
The strategy is executed using the `strategy.entry()` and `strategy.close()` functions:
- **Enter Long Positions**: When a buy signal is generated, the strategy opens a long position (buying).
- **Exit Positions**: When a sell signal is generated, the strategy closes the long position.
### 4. **Visual Indicators on the Chart**
To make the strategy easier to follow visually, buy and sell signals are marked directly on the chart:
- **Buy signals** are indicated with a green upward-facing triangle above the bar where the signal occurred.
- **Sell signals** are indicated with a red downward-facing triangle below the bar where the signal occurred.
### 5. **Key Elements of the Strategy**
- **Trend Continuation and Reversals**: This strategy is attempting to capture trends based on the breakout of important price levels (order blocks). When the price breaks above or below a significant order block, it is expected that the market will continue in that direction.
- **Order Block Strength**: Order blocks are considered strong areas where price action could reverse or accelerate, based on how institutional investors place large orders.
### 6. **Paper Trading**
This script uses **paper trading** to simulate trades without actual money being involved. This allows users to backtest the strategy, seeing how it would have performed in historical market conditions.
### 7. **Basic Strategy Flow**
1. **Order Block Identification**: The script constantly monitors price movements to detect bullish and bearish order blocks.
2. **Buy Signal**: If the closing price crosses above the last order block high, the strategy interprets it as a sign of bullish momentum and enters a long position.
3. **Sell Signal**: If the closing price crosses below the last order block low, it signals a bearish momentum, and the strategy closes the long position.
4. **Visual Representation**: Buy and sell signals are displayed on the chart for easy identification.
### **Advantages of the Strategy:**
- **Simple and Clear Rules**: The strategy is based on clearly defined rules for identifying order blocks and trade signals.
- **Effective for Trend Following**: By focusing on breakouts of order blocks, this strategy attempts to capture strong trends in the market.
- **Visual Aids**: The plot of buy/sell signals helps traders to quickly see where trades would have been placed.
### **Limitations:**
- **No Shorting**: This strategy only enters long positions (buying). It does not account for shorting opportunities.
- **No Risk Management**: There are no built-in stop losses, trailing stops, or profit targets, which could expose the strategy to large losses during adverse market conditions.
- **Whipsaws in Range Markets**: The strategy could produce false signals in sideways or choppy markets, where breakouts are short-lived and prices quickly reverse.
### **Overall Strategy Objective:**
The goal of the strategy is to enter into long positions when the price breaks above a significant order block, and exit when it breaks below. The strategy is designed for trend-following, with the assumption that price will continue in the direction of the breakout.
Let me know if you'd like to enhance or modify this strategy further!
ابحث في النصوص البرمجية عن "the strat"

FON60DK by leventsahThe strategy generates buy and sell signals using the Tillson T3 and TOTT (Twin Optimized Trend Tracker) indicators. Additionally, the Williams %R indicator is used to filter the signals. Below is an explanation of the main components of the code:
1. Input Parameters:
Tillson T3 and TOTT parameters: Separate parameters are defined for both buy (AL) and sell (SAT) conditions. These parameters control the sensitivity and behavior of the indicators.
Williams %R period: The period for the Williams %R indicator is set to determine overbought and oversold levels.
2. Tillson T3 Calculation:
The Tillson T3 indicator is a smoothed moving average that uses an exponential moving average (EMA) with additional smoothing. The formula calculates a weighted average of multiple EMAs to produce a smoother line.
The t3 function computes the Tillson T3 value based on the close price and the input parameters.
3. TOTT Calculation (Twin Optimized Trend Tracker):
The TOTT indicator is a trend-following tool that adjusts its sensitivity based on market conditions. It uses a combination of price action and a volatility coefficient to determine trend direction.
The Var_Func function calculates the TOTT value, which is then used to derive the OTT (Optimized Trend Tracker) levels for both buy and sell conditions.
4. Williams %R Calculation:
Williams %R is a momentum oscillator that measures overbought and oversold levels. It is calculated using the highest high and lowest low over a specified period.
5. Buy and Sell Conditions:
Buy Condition: A buy signal is generated when the Tillson T3 value crosses above the TOTT upper band (OTTup) and the Williams %R is above -20 (indicating an oversold condition).
Sell Condition: A sell signal is generated when the Tillson T3 value crosses below the TOTT lower band (OTTdnS) and the Williams %R is above -70 (used to close long positions).
6. Strategy Execution:
The strategy.entry function is used to open a long position when the buy condition is met.
The strategy.close function is used to close the long position when the sell condition is met.
7. Visualization:
The bars on the chart are colored green when a long position is open.
The Tillson T3, TOTT upper band (OTTup), and TOTT lower band (OTTdn) are plotted on the chart for both buy and sell conditions.
8. Plots:
The Tillson T3 values for buy and sell conditions are plotted in blue.
The TOTT upper and lower bands are plotted in green and red, respectively, for both buy and sell conditions.
Summary:
This strategy combines trend-following indicators (Tillson T3 and TOTT) with a momentum oscillator (Williams %R) to generate buy and sell signals. The use of separate parameters for buy and sell conditions allows for fine-tuning the strategy based on market behavior. The visual elements, such as colored bars and plotted indicators, help traders quickly identify signals and trends on the chart.

Forex Hammer and Hanging Man StrategyThe strategy is based on two key candlestick chart patterns: Hammer and Hanging Man. These chart patterns are widely used in technical analysis to identify potential reversal points in the market. Their relevance in the Forex market, known for its high liquidity and volatile price movements, is particularly pronounced. Both patterns provide insights into market sentiment and trader psychology, which are critical in currency trading, where short-term volatility plays a significant role.
1. Hammer:
• Typically occurs after a downtrend.
• Signals a potential trend reversal to the upside.
• A Hammer has:
• A small body (close and open are close to each other).
• A long lower shadow, at least twice as long as the body.
• No or a very short upper shadow.
2. Hanging Man:
• Typically occurs after an uptrend.
• Signals a potential reversal to the downside.
• A Hanging Man has:
• A small body, similar to the Hammer.
• A long lower shadow, at least twice as long as the body.
• A small or no upper shadow.
These patterns are a manifestation of market psychology, specifically the tug-of-war between buyers and sellers. The Hammer reflects a situation where sellers tried to push the price down but were overpowered by buyers, while the Hanging Man shows that buyers failed to maintain the upward movement, and sellers could take control.
Relevance of Chart Patterns in Forex
In the Forex market, chart patterns are vital tools because they offer insights into price action and market sentiment. Since Forex trading often involves large volumes of trades, chart patterns like the Hammer and Hanging Man are important for recognizing potential shifts in market momentum. These patterns are a part of technical analysis, which aims to forecast future price movements based on historical data, relying on the psychology of market participants.
Scientific Literature on the Relevance of Candlestick Patterns
1. Behavioral Finance and Candlestick Patterns:
Research on behavioral finance supports the idea that candlestick patterns, such as the Hammer and Hanging Man, are relevant because they reflect shifts in trader psychology and sentiment. According to Lo, Mamaysky, and Wang (2000), patterns like these could be seen as representations of collective investor behavior, influenced by overreaction, optimism, or pessimism, and can often signal reversals in market trends.
2. Statistical Validation of Chart Patterns:
Studies by Brock, Lakonishok, and LeBaron (1992) explored the profitability of technical analysis strategies, including candlestick patterns, and found evidence that certain patterns, such as the Hammer, can have predictive value in financial markets. While their study primarily focused on stock markets, their findings are generally applicable to the Forex market as well.
3. Market Efficiency and Candlestick Patterns:
The efficient market hypothesis (EMH) posits that all available information is reflected in asset prices, but some studies suggest that markets may not always be perfectly efficient, allowing for profitable exploitation of certain chart patterns. For instance, Jegadeesh and Titman (1993) found that momentum strategies, which often rely on price patterns and trends, could generate significant returns, suggesting that patterns like the Hammer or Hanging Man may provide a slight edge, particularly in short-term Forex trading.
Testing the Strategy in Forex Using the Provided Script
The provided script allows traders to test and evaluate the Hammer and Hanging Man patterns in Forex trading by entering positions when these patterns appear and holding the position for a specified number of periods. This strategy can be tested to assess its performance across different currency pairs and timeframes.
1. Testing on Different Timeframes:
• The effectiveness of candlestick patterns can vary across different timeframes, as market dynamics change with the level of detail in each timeframe. Shorter timeframes may provide more frequent signals, but with higher noise, while longer timeframes may produce more reliable signals, but with fewer opportunities. This multi-timeframe analysis could be an area to explore to enhance the strategy’s robustness.
2. Exit Strategies:
• The script incorporates an exit strategy where positions are closed after holding them for a specified number of periods. This is useful for testing how long the reversal patterns typically take to play out and when the optimal exit occurs for maximum profitability. It can also help to adjust the exit logic based on real-time market behavior.
Conclusion
The Hammer and Hanging Man patterns are widely recognized in technical analysis as potential reversal signals, and their application in Forex trading is valuable due to the market’s high volatility and liquidity. This strategy leverages these candlestick patterns to enter and exit trades based on shifts in market sentiment and psychology. Testing and optimization, as offered by the script, can help refine the strategy and improve its effectiveness.
For further refinement, it could be valuable to consider combining candlestick patterns with other technical indicators or using multi-timeframe analysis to confirm patterns and increase the probability of successful trades.
References:
• Lo, A. W., Mamaysky, H., & Wang, J. (2000). Foundations of Technical Analysis: Computational Algorithms, Statistical Inference, and Empirical Implementation. The Journal of Finance, 55(4), 1705-1770.
• Brock, W., Lakonishok, J., & LeBaron, B. (1992). Simple Technical Trading Rules and the Stochastic Properties of Stock Returns. The Journal of Finance, 47(5), 1731-1764.
• Jegadeesh, N., & Titman, S. (1993). Returns to Buying Winners and Selling Losers: Implications for Stock Market Efficiency. The Journal of Finance, 48(1), 65-91.
This provides a theoretical basis for the use of candlestick patterns in trading, supported by academic literature and research on market psychology and efficiency.

Premium ScalperThe strategy works with a combination of a number of different factors, including:
- Volume
- Moving averages
- Volatility
- RSI
This strategy generates long and short signals based on volume movements, moving averages and RSI. By combining other algorithms, low volatility periods can be filtered out.
The best results can be achieved by pairing the indicator with a bot through 3Commas and using a diversification strategy. This way you spread your risk over different pairs and you therefore also have a great chance of taking big moves.
The strategy results we display are results WITHOUT leverage. It is therefore also possible to only long on spot with this strategy, but for optimal results a trading bot link is required.
The settings we have used for these results are an order size of 100% with a 0.08% commission size.
Side note: This indicator does NOT use repainting!
We offer the possibility to try the indicator for free for 7 days.

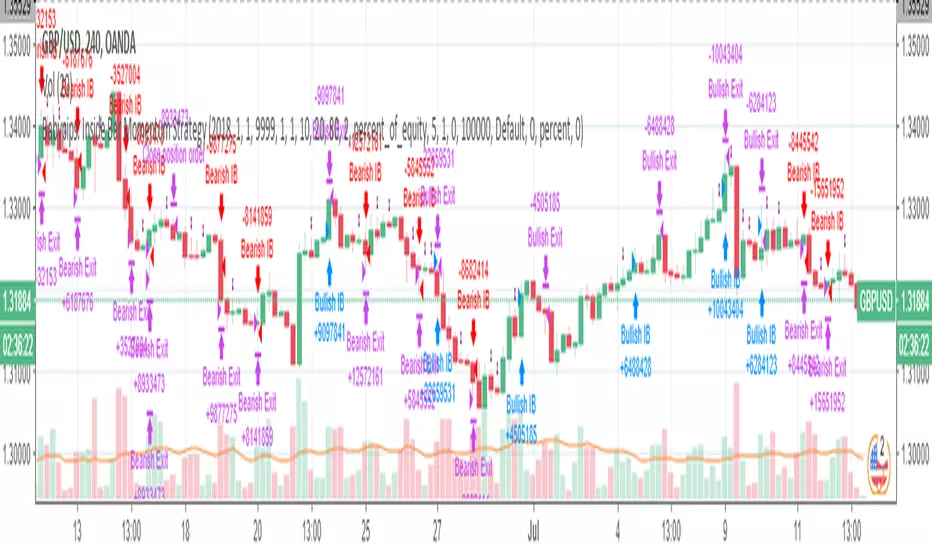
Babypips: Inside Bar Momentum StrategyThe strategy contained in this post comes courtesy of babypips (.com), an excellent resource for all thing forex related. If you are new to trading, the site is definitely worth checking out!
Code commentary and an introduction to Inside Bars are available for this post on the Backtest-Rookies (.com) website.
Note: If you are interested in custom development services, please check out our services page on the Backtest-Rookies site.
Strategy Overview
Inside Bar Momentum Strategy.
Inside Bar Detection
Position sizing based on stoploss distance ( Note: Based on equity and assumes that the account currency is the counter currency.
Stop buys for entries
Takeprofit / Stoplosses for exits
Control Stopbuy, Takeprofit and Stoploss targets with inputs
Control Backtest start/end dates
MTF EMA Hariss 369The strategy has been prepared in a simplistic manner and easy to understand the concept by any novice trader.
Indicators used:
Current Time frame 20 EMA- Gives clear look about current time frame dynamic support and resistance and trend as well.
Higher Time Frame 20 EMA: Gives macro level trend, support and resistance
Kama: Capture volatility and trend direction.
RVOL: Main factor of price movement.
Buy when price closes above current time frame 20 ema and current time frame 20 ema is above higher time frame 20 ema. Stop loss just below the low of last candle. One can use current time frame 20 ema, higher time frame 20 ema or kama as stop loss depending upon type of asset class and risk appetite. The ideal way is to keep 20 ema as trailing sl if one wants to trail with trend.
Sell when price closes below current time frame 20 ema and current time frame 20 ema is lower than higher time frame 20 ema. Stop loss just above high of last candle.
Ideal target is 1.5 or 2 times of stop loss.
Entry and exit time depends on trading style. Eg. if you want to enter and exit in 5 min time frame, then choose 15 min or 1h as higher time frame as trend filter. Buy and sell signals are also plotted based on this strategy. One should always go with the higher time frame trend. Opting higher time frame trend filter always filters out market noises.

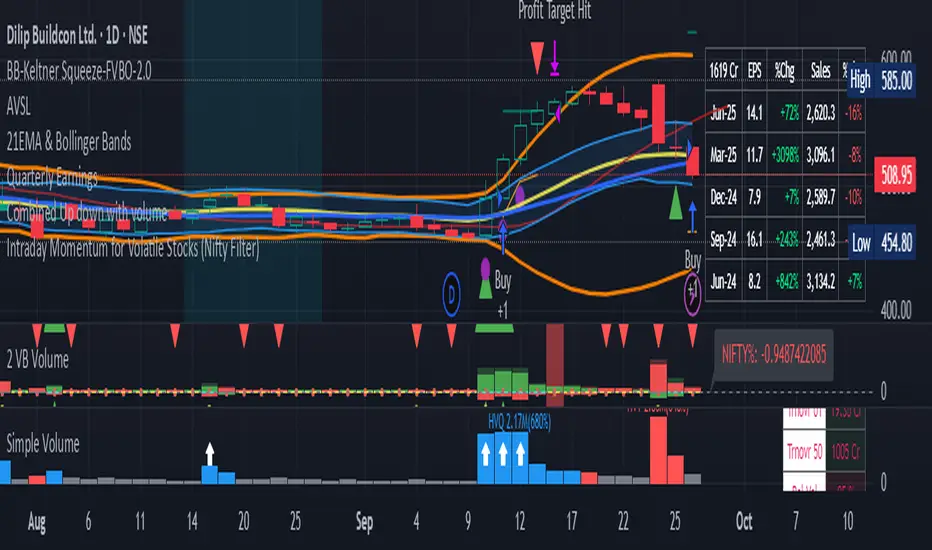
Intraday Momentum for Volatile Stocks 29.09The strategy targets intraday momentum breakouts in volatile stocks when the broader market (Nifty) is in an uptrend. It enters long positions when stocks move significantly above their daily opening price with sufficient volume confirmation, then manages the trade using dynamic ATR-based stops and profit targets.
Entry Conditions
Price Momentum Filter: The stock must move at least 2.5% above its daily opening price, indicating strong bullish momentum. This percentage threshold is customizable and targets gap-up scenarios or strong intraday breakouts.
Volume Confirmation: Daily cumulative volume must exceed the 20-day average volume, ensuring institutional participation and genuine momentum. This prevents false breakouts on low volume.
Market Regime Filter: The Nifty index must be trading above its 50-day SMA, indicating a favorable market environment for momentum trades. This macro filter helps avoid trades during bearish market conditions.
Money Flow Index: MFI must be above 50, confirming buying pressure and positive money flow into the stock. This adds another layer of momentum confirmation.
Time Restriction: Trades are only initiated before 3:00 PM to ensure sufficient time for position management and avoid end-of-day volatility.
Exit Management
ATR Trailing Stop Loss: Uses a 3x ATR multiplier for dynamic stop-loss placement that trails higher highs, protecting profits while giving trades room to breathe. The trailing mechanism locks in gains as the stock moves favorably.
Profit Target: Set at 4x ATR above the entry price, providing a favorable risk-reward ratio based on the stock's volatility characteristics. This adaptive approach adjusts targets based on individual stock behavior.
Position Reset: Both stops and targets reset when not in a position, ensuring fresh calculations for each new trade.
Key Strengths
Volatility Adaptation: The ATR-based approach automatically adjusts risk parameters to match current market volatility levels. Higher volatility stocks get wider stops, while calmer stocks get tighter management.
Multi-Timeframe Filtering: Combines intraday price action with daily volume patterns and market regime analysis for robust signal generation.
Risk Management Focus: The strategy prioritizes capital preservation through systematic stop-loss placement and position sizing considerations.
Considerations for NSE Trading
This strategy appears well-suited for NSE intraday momentum trading, particularly for mid-cap and small-cap stocks that exhibit high volatility. The Nifty filter helps align trades with broader market sentiment, which is crucial in the Indian market context where sectoral and index movements strongly influence individual stocks.
The 2.5% threshold above open price is appropriate for volatile NSE stocks, though traders might consider adjusting this parameter based on the specific stocks being traded. The strategy's emphasis on volume confirmation is particularly valuable in the NSE environment where retail participation can create misleading price movements without institutional backin
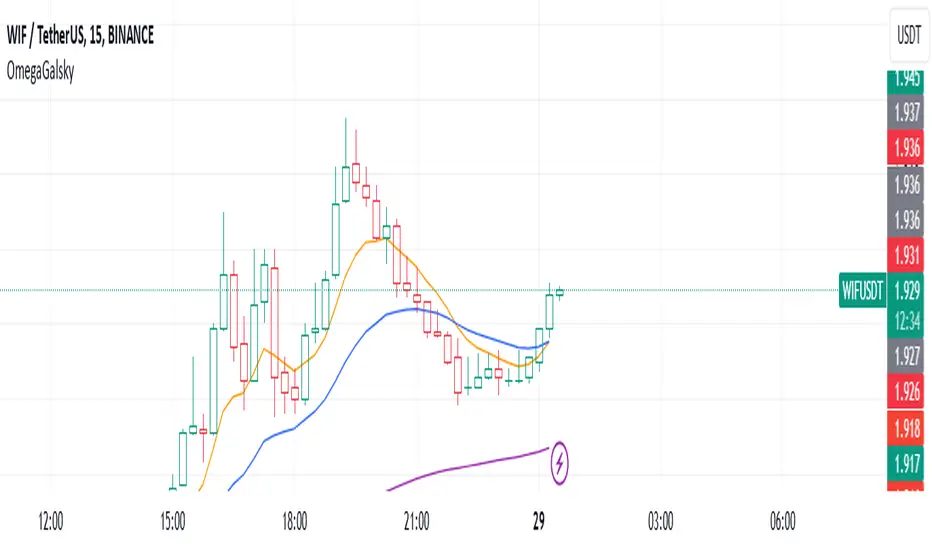
Omega_galskyThe strategy uses three Exponential Moving Averages (EMAs) — EMA8, EMA21, and EMA89 — to decide when to open buy or sell trades. It also includes a mechanism to move the Stop Loss (SL) to the Break-Even (BE) point, which is the entry price, once the price reaches a Risk-to-Reward (R2R) ratio of 1:1.
Key Steps:
Calculating EMAs: The script computes the EMA values for the specified periods. These help identify market trends and potential entry points.
Buy Conditions:
EMA8 crosses above EMA21.
The candle that causes the crossover is green (closing price is higher than the opening price).
The closing price is above EMA89.
If all conditions are met, a buy order is executed.
Sell Conditions:
EMA8 crosses below EMA21.
The candle that causes the crossover is red (closing price is lower than the opening price).
The closing price is below EMA89.
If all conditions are met, a sell order is executed.
Stop Loss and Take Profit:
Initial Stop Loss and Take Profit levels are calculated based on the entry price and a percentage defined by the user.
These levels help protect against large losses and lock in profits.
Break-Even Logic:
When the price moves favorably to reach a 1:1 R2R ratio:
For a buy trade, the Stop Loss is moved to the entry price if the price increases sufficiently.
For a sell trade, the Stop Loss is moved to the entry price if the price decreases sufficiently.
This ensures the trade is risk-free after the price reaches the predefined level.
Visual Representation:
The EMAs are plotted on the chart for easy visualization of trends and crossovers.
Entry and exit points are also marked on the chart to track trades.
Purpose:
The strategy is designed to capitalize on EMA crossovers while minimizing risks using Break-Even logic and predefined Stop Loss/Take Profit levels. It automates decision-making for trend-following traders and ensures disciplined risk management.
McClellan A-D Volume Integration ModelThe strategy integrates the McClellan A-D Oscillator with an adjustment based on the Advance/Decline (A-D) volume data. The McClellan Oscillator is calculated by taking the difference between the short-term and long-term exponential moving averages (EMAs) of the A-D line. This strategy introduces an enhancement where the A-D volume (the difference between the advancing and declining volume) is factored in to adjust the oscillator value.
Inputs:
• ema_short_length: The length for the short-term EMA of the A-D line.
• ema_long_length: The length for the long-term EMA of the A-D line.
• osc_threshold_long: The threshold below which the oscillator must drop for an entry signal to trigger.
• exit_periods: The number of periods after which the position is closed.
• Data Sources:
• ad_advance and ad_decline are the data sources for advancing and declining issues, respectively.
• vol_advance and vol_decline are the volume data for the advancing and declining issues. If volume data is unavailable, it defaults to na (Not Available), and the fallback logic ensures that the strategy continues to function.
McClellan Oscillator with Volume Adjustment:
• The A-D line is calculated by subtracting the declining issues from the advancing issues. Then, the volume difference is applied to this line, creating a “weighted” A-D line.
• The short and long EMAs are calculated for the weighted A-D line to generate the McClellan Oscillator.
Entry Condition:
• The strategy looks for a reversal signal, where the oscillator falls below the threshold and then rises above it again. The condition is designed to trigger a long position when this reversal happens.
Exit Condition:
• The position is closed after a set number of periods (exit_periods) have passed since the entry.
Plotting:
• The McClellan Oscillator and the threshold are plotted on the chart for visual reference.
• Entry and exit signals are highlighted with background colors to make the signals more visible.
Scientific Background:
The McClellan A-D Oscillator is a popular market breadth indicator developed by Sherman and Marian McClellan. It is used to gauge the underlying strength of a market by analyzing the difference between the number of advancing and declining stocks. The oscillator is typically calculated using exponential moving averages (EMAs) of the A-D line, with the idea being that crossovers of these EMAs indicate potential changes in the market’s direction.
The integration of A-D volume into this model adds another layer of analysis, as volume is often considered a leading indicator of price movement. By factoring in volume, the strategy becomes more sensitive to not just the number of advancing or declining stocks but also how significant those movements are based on trading volume, as discussed in Schwager, J. D. (1999). Technical Analysis of the Financial Markets. This enhanced version aims to capture stronger and more sustainable trends in the market, helping to filter out false signals.
Additionally, volume analysis is often used to confirm price movements, as described in Wyckoff, R. (1931). The Day Trading System. Therefore, incorporating the volume of advancing and declining stocks in the McClellan Oscillator offers a more robust signal for trading decisions.

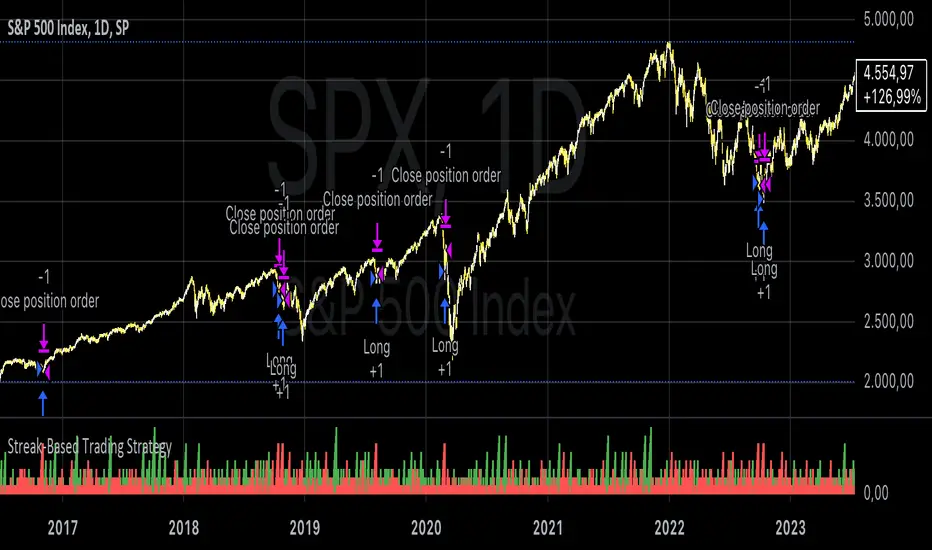
Streak-Based Trading StrategyThe strategy outlined in the provided script is a streak-based trading strategy that focuses on analyzing winning and losing streaks. It’s important to emphasize that this strategy is not intended for actual trading but rather for statistical analysis of streak series.
How the Strategy Works
1. Parameter Definition:
• Trade Direction: Users can choose between “Long” (buy) and “Short” (sell).
• Streak Threshold: Defines how many consecutive wins or losses are needed to trigger a trade.
• Hold Duration: Specifies how many periods the position will be held.
• Doji Threshold: Determines the sensitivity for Doji candles, which indicate market uncertainty.
2. Streak Calculation:
• The script identifies Doji candles and counts winning and losing streaks based on the closing price compared to the previous closing price.
• Streak counting occurs only when no position is currently held.
3. Trade Conditions:
• If the loss streak reaches the defined threshold and the trade direction is “Long,” a buy position is opened.
• If the win streak is met and the trade direction is “Short,” a sell position is opened.
• The position is held for the specified duration.
4. Visualization:
• Winning and losing streaks are plotted as histograms to facilitate analysis.
Scientific Basis
The concept of analyzing streaks in financial markets is well-documented in behavioral economics and finance. Studies have shown that markets often exhibit momentum and trend-following behavior, meaning the likelihood of consecutive winning or losing periods can be higher than what random statistics would suggest (see, for example, “The Behavior of Stock-Market Prices” by Eugene Fama).
Additionally, empirical research indicates that investors often make decisions based on psychological factors influenced by streaks. This can lead to irrational behavior, as they may focus on past wins or losses (see “Behavioral Finance: Psychology, Decision-Making, and Markets” by R. M. F. F. Thaler).
Overall, this strategy serves as a tool for statistical analysis of streak series, providing deeper insights into market behavior and trends rather than being directly used for trading decisions.
[Shoshi] Better Than UCTS StrategyThe Strategy is a versatile trading strategy designed to work across various timeframes and assets, with customizable presets tailored for different market conditions. This strategy leverages a combination of Exponential Moving Averages (EMAs) to identify trend directions and entry points. It includes the following key features:
**EMA Crossovers:**
Utilizes short-term and long-term EMAs to generate buy and sell signals when a crossover occurs.
**Customizable Take Profits (TP1, TP2):**
Define up to two take-profit levels to lock in gains. These can be activated or deactivated as needed.
**Stop Loss and Break-Even:**
Implements a dynamic stop loss that can adjust to break-even after hitting the first take-profit level, providing additional risk management.
**Time and Volume Filters:**
Optional filters to avoid signals in low-volume or unfavorable time periods, enhancing the reliability of the signals.
**Risk Management Tools:**
Includes maximum drawdown, losing streak, and intraday loss limits to safeguard your capital.
This strategy is fully configurable, allowing traders to adjust settings to suit their specific needs and market conditions, making it a powerful tool for both beginner and experienced traders.
HMA Crossover 1H with RSI, Stochastic RSI, and Trailing StopThe strategy script provided is a trading algorithm designed to help traders make informed buy and sell decisions based on certain technical indicators. Here’s a breakdown of what each part of the script does and how the strategy works:
Key Components:
Hull Moving Averages (HMA):
HMA 5: This is a Hull Moving Average calculated over 5 periods. HMAs are used to smooth out price data and identify trends more quickly than traditional moving averages.
HMA 20: This is another HMA but calculated over 20 periods, providing a broader view of the trend.
Relative Strength Index (RSI):
RSI 14: This is a momentum oscillator that measures the speed and change of price movements over a 14-period timeframe. It helps identify overbought or oversold conditions in the market.
Stochastic RSI:
%K: This is the main line of the Stochastic RSI, which combines the RSI and the Stochastic Oscillator to provide a more sensitive measure of overbought and oversold conditions. It is smoothed with a 3-period simple moving average.
Trading Signals:
Buy Signal:
Generated when the 5-period HMA crosses above the 20-period HMA, indicating a potential upward trend.
Additionally, the RSI must be below 45, suggesting that the market is not overbought.
The Stochastic RSI %K must also be below 39, confirming the oversold condition.
Sell Signal:
Generated when the 5-period HMA crosses below the 20-period HMA, indicating a potential downward trend.
The RSI must be above 60, suggesting that the market is not oversold.
The Stochastic RSI %K must also be above 63, confirming the overbought condition.
Trailing Stop Loss:
This feature helps protect profits by automatically selling the position if the price moves against the trade by 5%.
For sell positions, an additional trailing stop of 100 points is included.

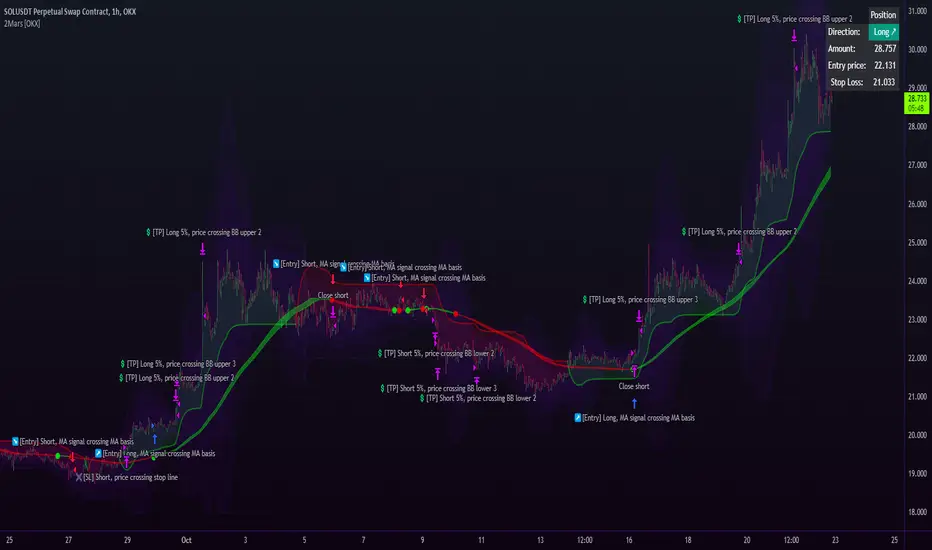
2Mars strategy [OKX]The strategy is based on the intersection of two moving averages, which requires adjusting the parameters (ratio and multiplier) for the moving average.
Basis MA length: multiplier * ratio
Signal MA length: multiplier
The SuperTrend indicator is used for additional confirmation of entry into a position.
Bollinger Bands and position reversal are used for take-profit.
About stop loss:
If activated, the stop loss price will be updated on every entry.
Basic setup:
Additional:
Alerts for OKX:
Buy Only Strategy with Dynamic Re-Entry and ExitThe strategy aims to create a simple buy-only trading system based on moving average crossovers and the Weekly Commodity Channel Index (CCI) or Weekly Average Directional Index (ADX). It generates buy signals when the fast-moving average crosses above the slow-moving average and when the Weekly CCI and or Weekly ADX meet the specified conditions.
The strategy also allows for dynamic re-entry, which means it can open new long positions if the price goes above the three moving averages after an exit. However, the strategy will exit the long position if the price closes below the third moving average.
ENTRY CONDITIONS
The script defines the conditions for generating buy signals. It checks for two conditions for a valid buy signal:
• If the fast-moving average crosses above the slow-moving average -THERE IS Dynamic Re-Entry also
• If the user chooses HE OR SHE CAN FILTER TRADES BY USING CCI OR ADX
Dynamic Re-Entry:
the script allows for dynamic re-entry. If there is no active long position and the price is above all three moving averages a new long position is opened.
Exit Conditions
The script defines the exit condition for closing a long position. If the price closes below the third moving average, the script closes the long position.
IMPORTANT NOTICE
ONLY DAILY TIME FRAME
THERE WOULD BE WHIPSAW USE YOUR OWN ACCUMEN TO MINIMISE THEM
ITS ONLY BUY STRATEGY
EXIT CAN BE STRATEGY BASED OR SET PROFIT AND TARGETS AS PER RISK APETITE /RISK MANAGEMENT
DONT TRADE OPTIONS ON THIS
SUITABLE FOR STOCKS OF USA AND INDIAN MARKETS
ALWAYS REMEMBER TO DO YOUR OWN RESEARCH BEFORE TRADING AND INVESTING

Stochastic RSI Strategy (with SMA and VWAP Filters)The strategy is designed to trade on the Stochastic RSI indicator crossover signals.
Below are all of the trading conditions:
-When the Stochastic RSI crosses above 30, a long position is entered.
-When the Stochastic RSI crosses below 70, a short position is entered.
-The strategy also includes two additional conditions for entry:
-Long entries must have a positive spread value between the 9 period simple moving average and the 21 period simple moving average.
-Short entries must have a negative spread value between the 9 period simple moving average and the 21 period simple moving average.
-Long entries must also be below the volume-weighted average price.
-Short entries must also be above the volume-weighted average price.
-The strategy includes stop loss and take profit orders for risk management:
-A stop loss of 20 ticks is placed for both long and short trades.
-A take profit of 25 ticks is placed for both long and short trades.

Candles - The WhaleThe strategy is based on candle patterns, with confluence indicators. Note some of the candles are rare, they can be found only a specific timeframe, or within specific stocks.
The added patterns are as follows:
- Bullish Engulfing
It is formed by two candles, the second candlestick engulfing the first candlestick. The first candle is a bearish candle that indicates the continuation of the downtrend.
The second candlestick is a long bullish candle that completely engulfs the first candle and shows that the bulls are back in the market.
- Bullish Harami
It consists of two candlestick charts, the first candlestick being a tall bearish candle, and the second, being a small bullish candle which should be in the range of the first candlestick.
The first bearish candle shows the continuation of the bearish trend and the second candle shows that the bulls are back in the market.
- Piercing Line
Two candles from it, the first candle being a bearish candle which indicates the continuation of the downtrend.
The second candle is a bullish candle that opens the gap down but closes more than 50% of the real body of the previous candle, which shows that the bulls are back in the market and a bullish reversal is going to take place.
- Bullish Belt
A Bullish Belt Hold, known as “yorikiri” in Japanese, is a single Japanese candlestick pattern that suggests a possible reversal of the current downtrend.
- Bullish Kicker
A bullish kicker is a two candlestick pattern that’s usually formed after a significant downtrend, but could also appear after an uptrend.
- Abandoned Baby
The abandoned baby candlestick pattern is a three-bar reversal pattern. It is similar to the morning and evening star formations and is a very reliable reversal signal when it occurs after a sharp rise or drop.
- Homing Pigeon
The bullish homing pigeon is a two-candle bullish reversal pattern that occurs at the end of a bearish trend. Both candles are negative, but the second candle is confined within the range of the previous candle.
- Breakaway
Breakaway patterns are multi-candle formations found on Japanese candlestick charts that suggest a market reversal may be in the offing. An actual breakaway is a five candlestick formation that occurs in either an upward or downward trend.
- Concealing Baby Swallow
The Concealing Baby Swallow candlestick pattern is a four-candlestick pattern that can signal a bullish reversal price movement or a bearish continuation move, depending on where it occurs in the overall market structure. However, the pattern is quite rare, and you may not encounter it in your trading.
- Doji Dragonfly
A dragonfly doji can be an indicator of a reversal in price. When the price of a security has shown a downward trend, it might signal an upcoming price increase.
- Doji Gravestone
The Gravestone Doji forms when the price closes at relatively the same level where it opened, providing that the open coincides with the low or at least the two are very close
- Doji Star
Consists of a long bullish candle, followed by a Doji that gaps up, then a third bearish candle that gaps down and closes well within the body of the first candle. An Evening Doji Star is a three-candle bearish reversal pattern similar to the Evening Star.
- Kicker
A kicker pattern is a two-bar candlestick pattern that predicts a change in the direction of an asset's price trend. This pattern is characterized by a sharp reversal in price over the span of two candlesticks. Traders use it to determine which group of market participants is in control of the direction.
- Ladder Bottom
Is a five-candle bullish reversal pattern that occurs at the end of a bullish trend. The four first candles are bearish and followed by a positive candle that starts with a positive gap.
- MatHold
A bullish pattern begins with a large bullish candle followed by a gap higher and three smaller candles which move lower.
- Matching Low
A matching low is a bullish two-candle reversal pattern that forms in an ongoing downtrend. As to its appearance, a matching low consists of two candlesticks that are negative, but the close at or around the same price.
- Meeting Lines
Bullish meeting lines are a two-candle bullish reversal pattern that occurs in a downtrend and signals a reversal of the trend. The first candle of the bullish meeting lines is bearish, and followed by a positive candle that closes very near the close of the previous candle.
- Morning Doji Star
It is made of 3 candlesticks, the first being a bearish candle, the second, a Doji, and the third being a bullish candle.
The first candle shows the continuation of the downtrend. The second candle being a doji indicates indecision in the market. The third bullish candle shows that the bulls are back in the market and a reversal will take place. The second candle should be completely out of the real bodies of the first and third candles.
- Rising Three Method1
Rising three methods is a bullish continuation pattern that appears in an ongoing uptrend. The Rising three methods pattern consists of five candles. where the first and last candles are long and bullish, with three small bearish candles in between.
- Rising Three Method2
It is the same as "Rising Three Method1" but with a different calculation
- Upside Tasuki Gap1
Is a bullish continuation candlestick pattern that forms in an ongoing uptrend. It consists of three candles, where the two first are bullish with a positive gap in-between, and followed by a negative candle that closes in the gap formed between the first two candles.
- Upside Tasuki Gap2
It is the same as "Upside Tasuki Gap1" but with a different calculation
- Three Line Strike1
Is a four-candle bullish continuation candlestick pattern. It forms a bullish trend and is believed to signal the continuation of the bullish trend.
- Three Line Strike2
It is the same as "Three Line Strike2" but with a different calculation
The confluence indicators:
Movement Averages: multi options checks, you can select what to check to open a position, and the description of each open is in the strategy.
Volume Oscillator: positive signal if the volume is above zero.
EMA: positive signal if the candle source is above EMA.
VWAP: positive signal if the candle source is above VWAP.
BTC Trend: it is an equation to track the BTC price movement
The profit is based on TSL, while the stop loss is based on ATR, or lowest candle.
The recommended time frame is 4 hours.

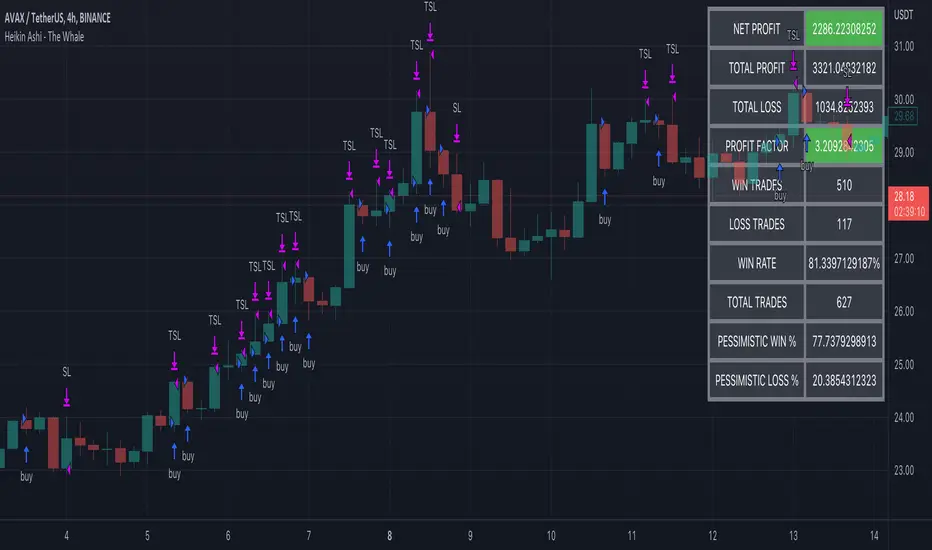
Heikin Ashi - The WhaleThe strategy is based on Heikin Ashi calculation, you do not need to switch the candle to HA.
The HA is used as a base entry, if a candle or two candles are bullish, then is valid to open a position, you can select the validation, one or two candles.
Also, the strategy mainly uses volume indicators as a confluence, you can select VWAP , VWMA , and Volume Oscillator, in addition to ADX which has two ways to validate the entry.
Base entry: One or two bullish HA candles (candles without a lower wick)
Confluence Indicators:
ADX: Will give a positive signal only if ADX is above the threshold, or if +DI is above -DI, or both.
VWAP: will give a positive signal if HA close is above VWAP.
VWMA: composite of 3 MA (20, 25, 50). There are multiple options to set it as confluence, the first option is to check if the short is bigger than the long and long is bigger than the base. The other options are to check the close status, which is bigger than which MA. You can find the description of each option in the strategy box
The sell is based on trailing stop loss (TSL), while the stop loss is based lowest X candle, the strategy will look back to the lowest number of the HA candles and set it as stop loss.
AlphaTrend StrategyThe strategy version of AlphaTrend indicator for backtesting and optimisation purposes for TradingView users:
Screener / Explorer version and an English explantion video will be published soon...
AlphaTrend's parameters are designed for daily and 4H charts, feel free to optimize on all time frames.
Hope you all use Alphatrend in your profitable trades.
Kıvanç

Pinbar trailing stop strategyThe strategy finds the nearest pinbar pattern and opens a position (long or short). You choose your take profit and stop loss multiplier.
Take Profit - X times the pinbar size from it's highest point.
Stop loss - X times the pinbar size from it's lowest point.
You can find more detailed screenshots and the source-code on my github page: samgozman/pinbar-strategy-tradingview

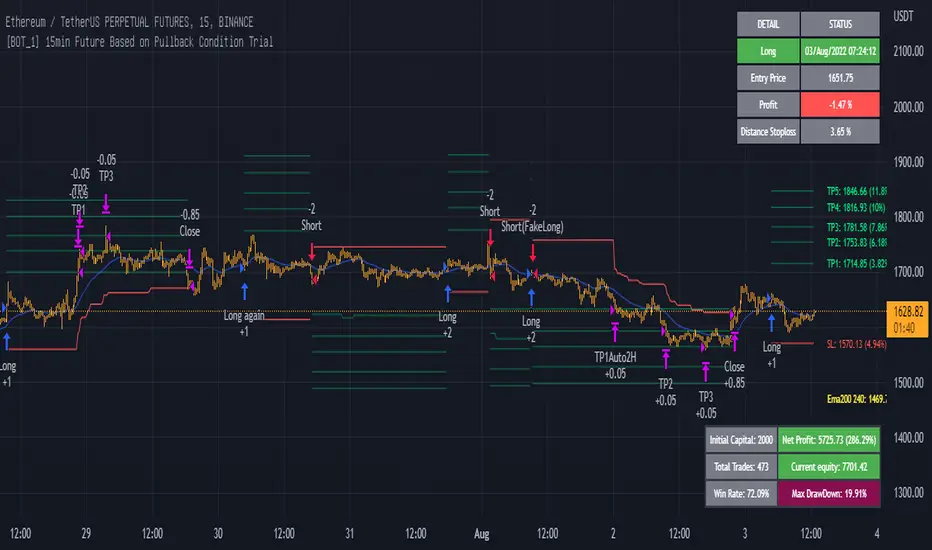
15min ETH Binance Future Full for auto tradingThe strategy is optimized for ETHBUSDPERP or ETHUSDTPERP pairs on Binance Future. With other altcoins, you need change set up of indicators.
This is a swing strategy to follow the trend on the 15m frame, use the pullback condition in the smaller timeframe to enter the trade.
Entry long: price close above ema10 and ema30, macd(12,26,9) (tf1m) < macd(12,26,9) (tf1m) and rsi < 80 (not overbought) and parabol sar is below price
Exit long: price hit TP1, TP2, ... or touch stoploss or have entry short signal
Entry short: price close below ema10 and ema30, macd(12,26,9) (tf1m) > macd(12,26,9) (tf1m) and rsi > 20 (not oversold) and parabol sar is aboce price
Exit short: price hit TP1, TP2, ... or touch stoploss or have entry long signal
In addition, the strategy also has profit risk management feature: move stoploss to entry and take multiprofit, plot resistant in higher timeframe 1D, 4H for activing take profit.
If you find any helpful for your trading and need scripts, please inbox to me.
You are welcom!
Long TermThe Strategy is to buy based on Stan which is long term strategy on stocks. This works on 30WEEK And RSI indicator which helps to understand when to enter stock and when not to.
Additionally due to fast moving trades, added logic of crossover of close price above 50DMA

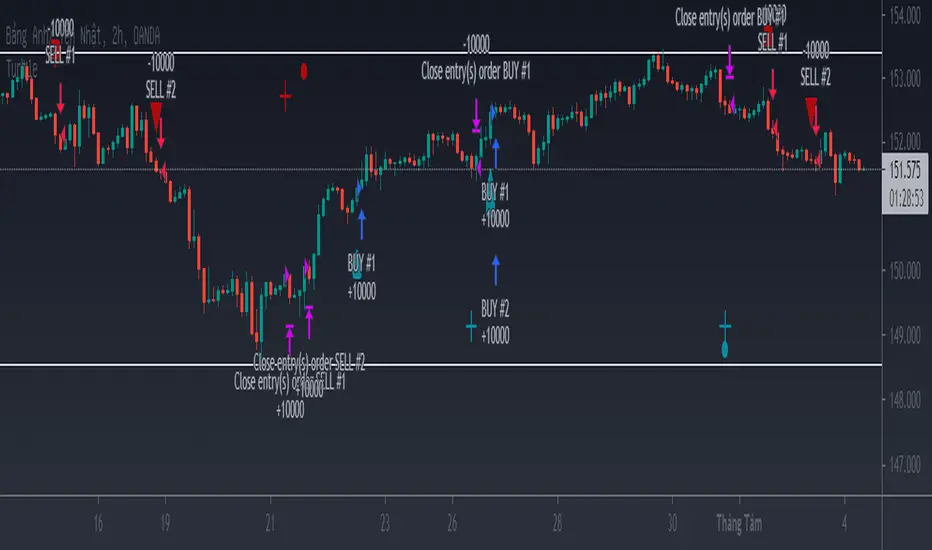
Turtle StrategyThe strategy uses the breakout method to enter an order. Look for areas of price compression to wait for a breakout. Use trailing stoploss to keep the order until the end of the trend.
Example using 10000 contract size with GBPJPY , slippage is 3 and commission per order is 0.3$, with actual capital of 10000$, you can adjust other contract size for other pairs to consistent with reality.
Momentum Trading Strategy (Weekly Chart)The strategy will open position when there is momentum in the stock
The strategy will ride up your stop loss based on the super trend.
The strategy will close your operation when the market price crossed the stop loss.
The strategy will close operation when the line based on the volatility will crossed
